Welcome to my page. I'm interested in how the U.S. Government engages with foreign publics.
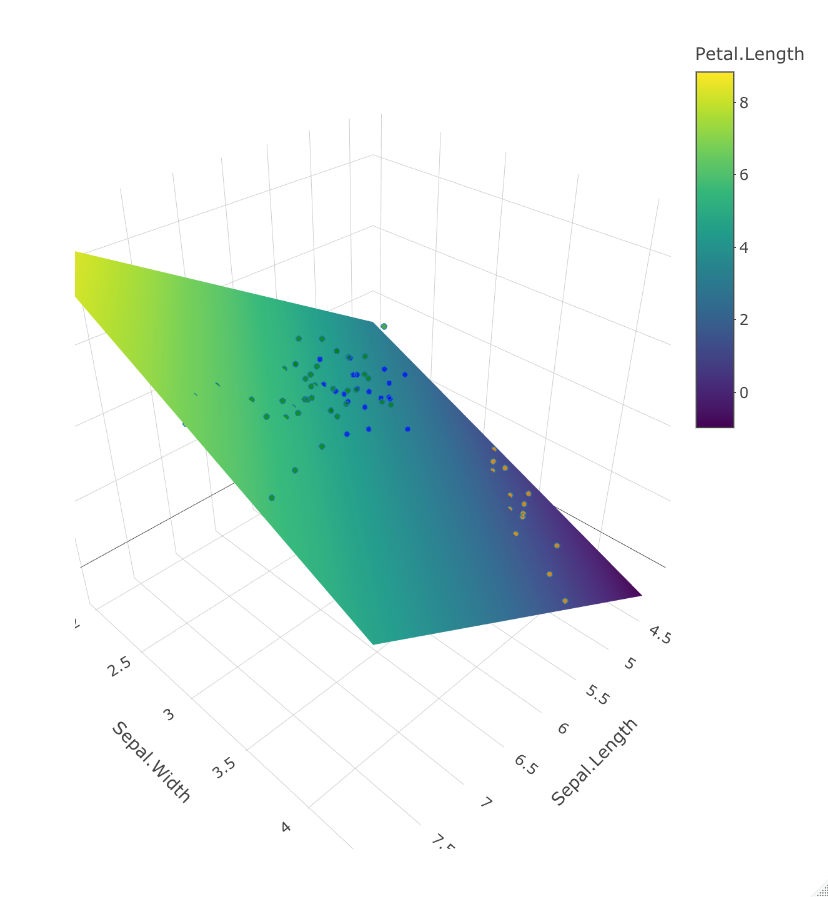
Assignment07_Logistic_Regression
Marcus Sianan
EPPS 6323: Knowledge Mining
This is a word cloud produced from Winston Churchill’s speech (available at http://www.historyplace.com/speeches/churchill-hour.htm).

Marcus Sianan
EPPS 6323: Knowledge Mining
This is a visualization produced from Lab 3.
Marcus Sianan
EPPS 6323: Knowledge Mining
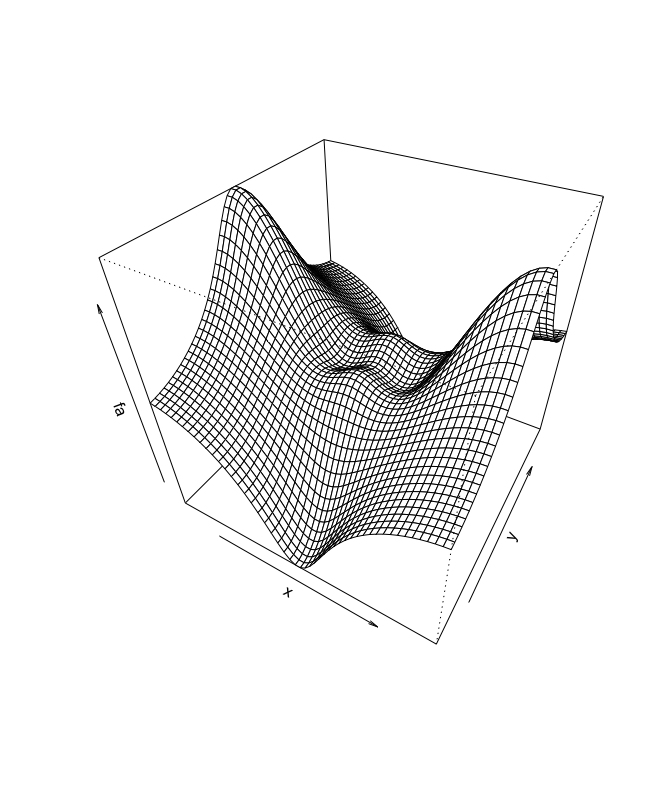
This is a visualization produced from Lab 2.

Marcus Sianan
EPPS 6323: Knowledge Mining
This is a visualization produced from Lab 1.
Marcus Sianan
EPPS 6323: Knowledge Mining
February 2, 2022
This is a review for my graduate course (EPPS 6323: Knowledge Mining) comparing Shmueli (2010) with Breiman (2001). A brief discussion of each article is provided next. Following that is a more explicit comparison of the two articles that highlights in a cursory manner some of the similarities and differences between them.
Shmueli (2010) endeavors to elucidate the distinction between explanation (explanatory modeling) and prediction (predictive modeling), which have different goals, but are nevertheless commonly conflated. The author clarifies that explanation and prediction are not the same, and argues that an understanding of the two concepts (and what sets them apart) is necessary to advance scientific knowledge. The author further argues that having such knowledge of the two different types of modeling is vital for proper statistical modeling, and paramount for proper scientific usage.
According to Shmueli (2010), explanatory modeling involves the utilization of statistical models to test causal explanations. With explanatory modeling, theory plays a vital role because practitioners of this type of modeling use theory to provide the causality; decisions regarding data and modeling are largely driven by whatever theory is applied to the study by the researcher. Predictive modeling, on the other hand, relies on the application of a statistical model or data-mining algorithm in order to make a prediction, and can refer to any method with the ability to produce predictions. While both models have advantages and disadvantages, the author notes that the benefit of a predictive model over an explanatory model is that the former model will observably either produce an accurate prediction or not. The latter model, however, cannot be confirmed and is more difficult to contradict.
Breiman (2001) is concerned with discussing two cultures extant in the scholarly practice of statistical modeling. One culture, the data modeling culture, is predicated on the assumption that data generation is the result of a given stochastic model. The other culture, the algorithmic modeling culture, utilizes algorithmic models and assumes that the data-generating mechanism is unknown. To articulate the difference between the models, the author describes a black box in which independent variables go into one side and experience nature inside the box, and dependent variables come out of the other side. With the data modeling culture, “The values of the parameters are estimated from the data and the model then used for information and/or prediction” (Breiman, 2001, p. 199). With the algorithmic modeling culture, the analysis “…Considers the inside of the box complex and unknown. Their approach is to find a function f(x)-an algorithm that operates on x to predict the responses y” (Breiman, 2001, p. 199).
What the Shmueli (2010) and Breiman (2001) articles have in common is that they each elaborate on what are essentially two different approaches to research that are situated in a specific facet of the scientific community. For Shmueli, it is about the explanatory approach to modeling versus the predictive approach to modeling. Shmueli emphasizes the benefit of having a clear understanding of the two concepts. For Breiman, it is about the differences between one scholarly culture and another and how the adopting of either will impact the course of one’s research.
Both articles are also concerned with prediction and information. Breiman’s (2001) example of a black box that generates data deals with two goals to analyze the generated data: prediction and information. And, while Shmueli (2010) focuses mostly on prediction, information plays a key role in the author’s discussions, even if it is more in the background.
Also, both articles are characterized by a similar writing configuration in that two things are discussed as distinct entities and are contrasted along the way. In the Shmueli (2010) article, the author describes explanation, then describes prediction, and while that is going on, the reader gets a sense of how the two compare with each other and how they can be reconciled. In the Breiman (2001) article, the author describes the data modeling culture, then describes the algorithmic modeling culture (and so forth like Shmueli).
A difference between the articles is that while Shmueli (2010) seems to bestow equal merit to both explanatory and predictive models, Breiman (2001) appears to favor the algorithmic modeling culture over the data modeling culture. For the algorithmic modeling culture, Breiman provides a roadmap of considerations for the scholar to be cognizant of when delving into the culture, whereas with the data modeling culture, the author focuses more on the problems associated with data models.
Another difference between the articles is that while Breiman (2010) asserts that “The criterion for any model is what is the predictive accuracy” (p. 205), Shmueli (2010) would perhaps argue that the criterion for a predictive model is predictive accuracy (and that the criterion for an explanatory model is explanatory ability).
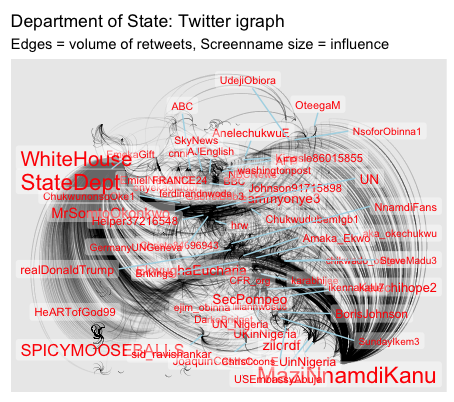
Below is an igraph that shows the number of retweets based upon the Twitter account of the U.S. Department of State, @StateDept (n = 1,000).
Next, we have an igraph that shows the number of retweets based upon the keywords “foreign public dialogue” (n = 100).
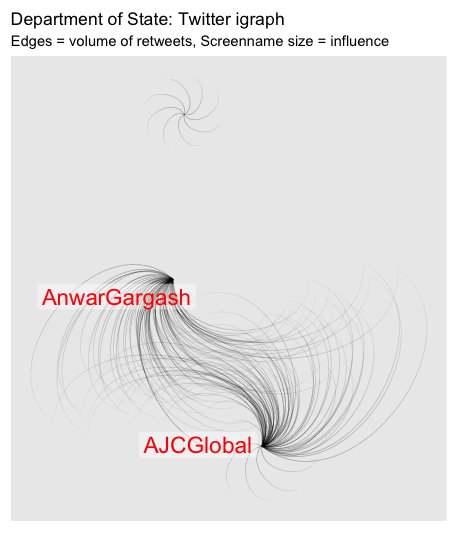
Note: both igraphs were produced in R using data generated by the API method.
Below are links to two CSV files that contain Twitter data (e.g., tweets, retweets, favorites, and frequency of users). The first CSV file is comprised of data based on the Twitter handle, @USEmbassyBKK (the U.S. embassy in Bangkok). The data cover November 1, 2019, to March 6, 2020. The second CSV file is based on a query of the keywords, “embassy dialogue.” The data cover January 2, 2019, to January 15, 2020.
We also have an Excel file below that visualizes the Twitter data for the first aforementioned CSV file.
USEmbassyBKK Twitter visualization
Next, we have plots to visualize the Twitter data of the second aforementioned CSV file.
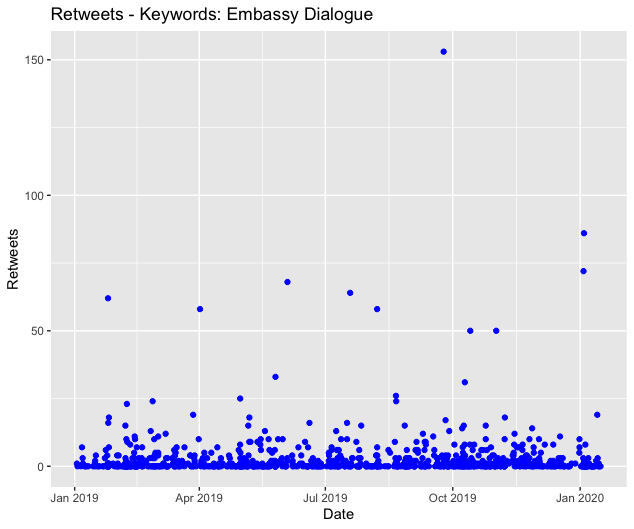
Total retweets = 2537

Total replies = 876
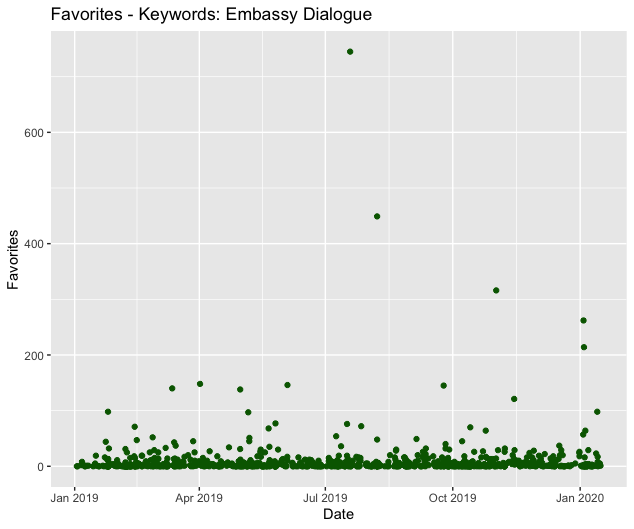
Total favorites = 8246
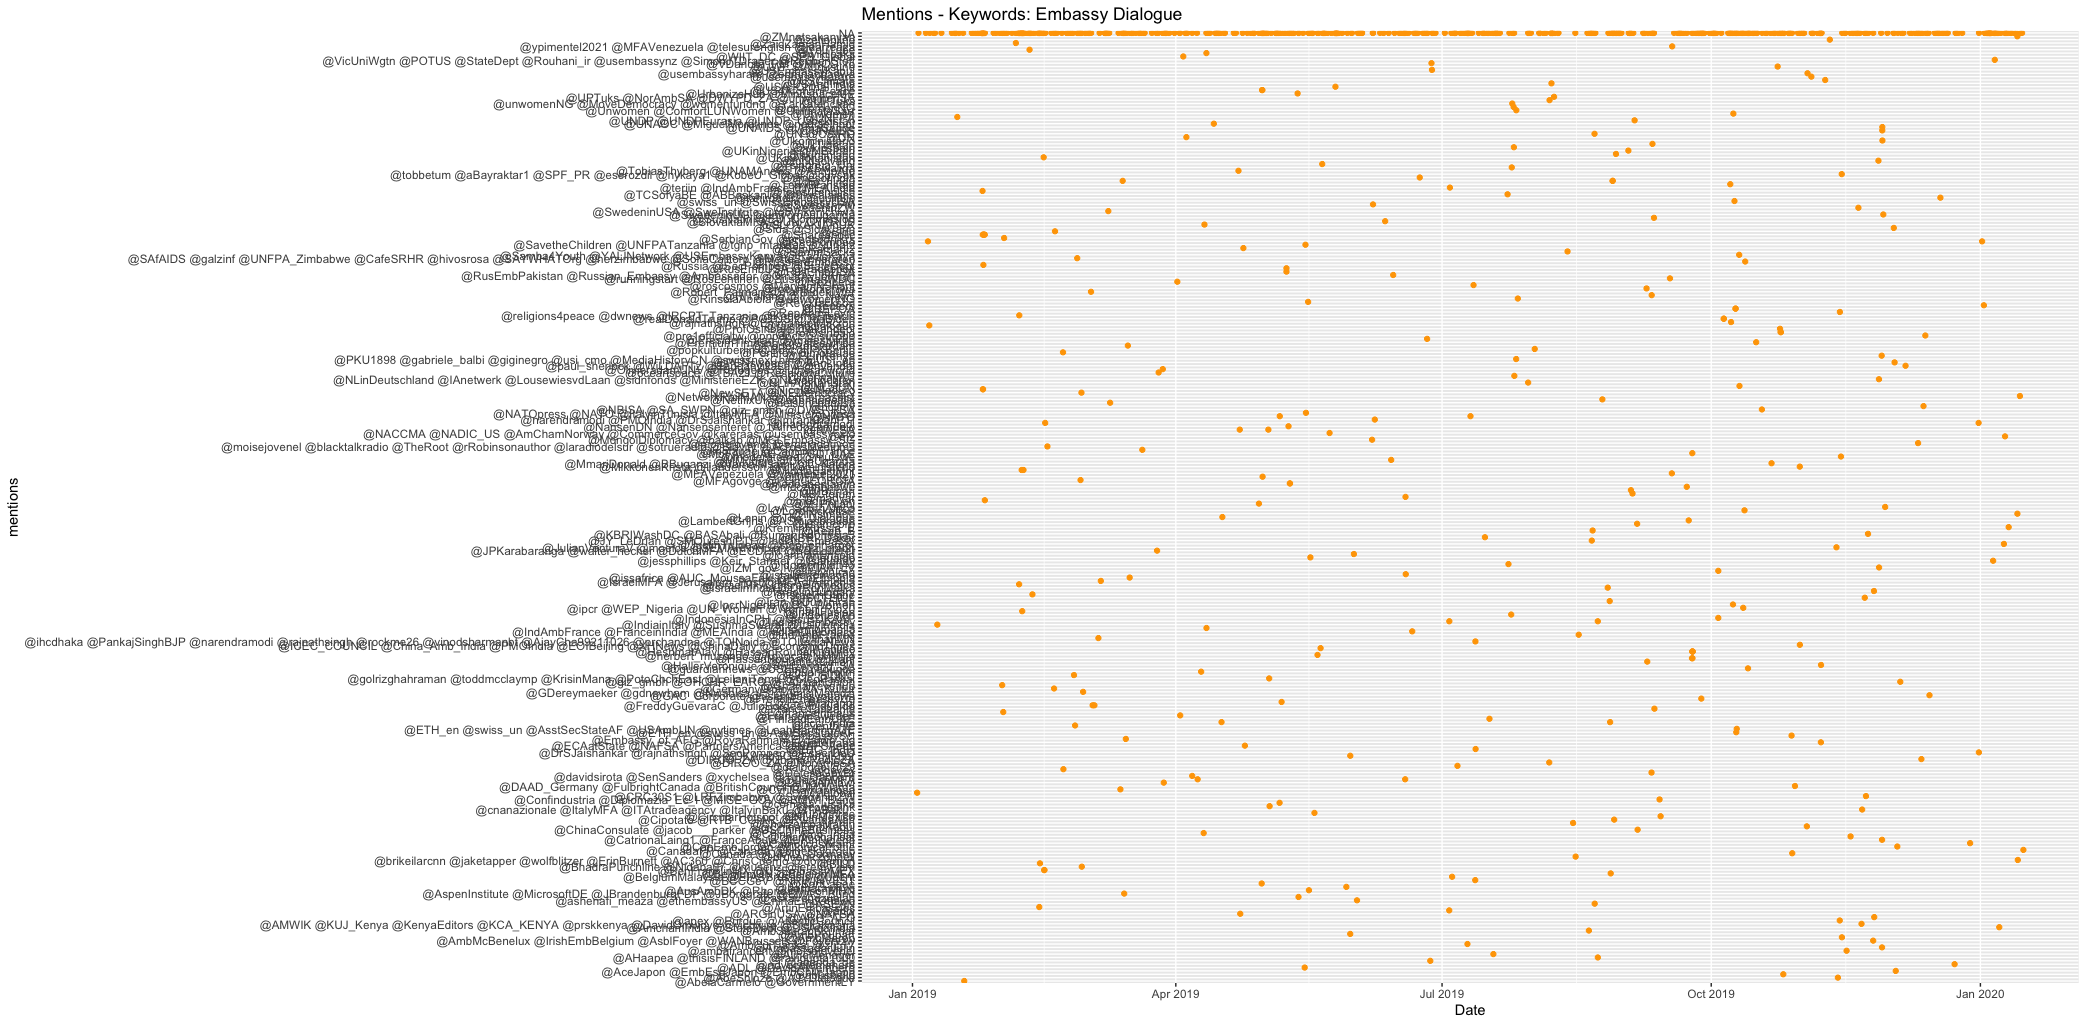
Total mentions = 881
Note: the above plots were produced in R using data generated by the non-API method.